RECENT COMMENTS
Joel Cabot on Power Outage on the Hill
Eric S. Huffstutler on What is up with the Church Hill Post Office?
Eric S. Huffstutler on What is up with the Church Hill Post Office?
Yvette Cannon on What is up with the Church Hill Post Office?
crd on Power Outage on the Hill
on “the awkward (at best) race relations in Richmond”
01/31/2009 4:32 PM by John M
Caramelized OpiNIONS, a blog for Jason Guard’s writing that is self-described as “food blog, frugality, and uncouth social action”, pokes a stick at the “inflamed polarization” that is the racial divide across much of Richmond.
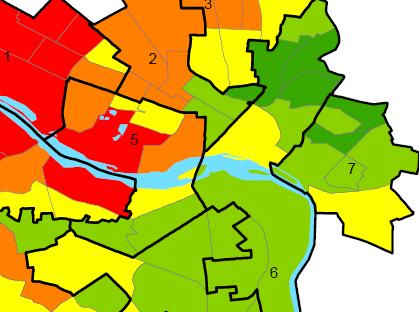
ABOVE: Percent African-American / BELOW: Estimated Average Household Income (click either to view larger and with more context)
TAGGED: map





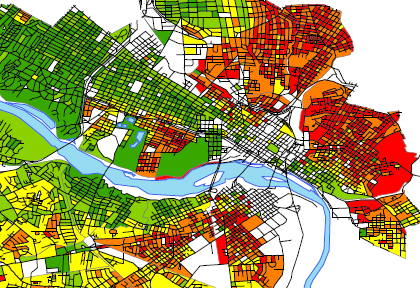
I actually find this very interesting (and would also love to be able to compare it to 2009). Is there a way to make it big enough to be able to get an idea of individual streets?
I got the maps at least 3rd hand. Jason said that the maps were created by a friend of his while he attended VCU’s urban planning program.
You might also find this map from 1923 to be interesting, too.
I’m glad that this blog post of mine could turn out to be useful to more people than just me. The GIS maps belong to a friend of mine who created them while doing a project as a student at VCU’s Urban Planning Dept. When he showed them to me in 2003, I begged for a copy, and I’ve been using them in various projects (like the Living Wage campaign). If I can track him down (we haven’t been in touch in a while), I’ll see if he has more detailed versions. Nonetheless, based on some of the landmark intersections, you can infer which neighborhoods fall into which categories, and maybe even block-by-block.
Jason, it’s really fascinating. I’d really like to see what it looks like now, nine years after that census data was taken – I think I read that the data is from the 2000 census? Several people I know think that the demographics have changed a lot since then, but we have no proof at all. When’s the next census? 2010? Are there any figures available prior to that date? And in regards to your search to find guy, and potentially get more details, keep us posted, thanks.
This is very interesting data. I’m with crd; I wonder how this might trend over the past decade (or going back further).
On the first map, anyone know what’s the bright red dot in the far west/southwest?
As someone who does a lot of work with demographics, I suggest you all check out the American FactFinder website: http://factfinder.census.gov/home/saff/main.html?_lang=en It’s the best resource for finding information related to the U.S. Census since it is, after all, managed by the Census Bureau. There is more up to date information (2007 appears to be the most recent) through the American Community Survey (also on that website), but the most detailed level of information (in terms of geographic boundaries) is for the City as a whole because of the sample size that was used. By the way, Census Day is April 1, 2010, so get ready and send in your forms ASAP because this is the information that the federal government uses to appropriate funds at the state and local level for various programs. Also, I agree with crd, I think that the demographics have changed significantly since the 2000 Census. I think we’ll begin to see a more heterogenous neighborhood in Church Hill; more than likely that Broad Streeet line will probably spill over into the Northern area. My guess is that it will extend further north to probably around Leigh St and will be in the light green to yellow range (if you use the same percentage breakdowns used in that map). Of course, we’ll only know for sure once of all the data has been reported and released.
09-02_SEA_REPORT_Not_an_Audit.pdf
This report released by Richmond’s City Auditor is most revealing of the core elements of the ongoing racial inequities in the City of Richmond.
If the link doesn’t work, go to the City of Richmond home page, search for City Auditor, once there, look for the report that was released in September 2008.
John did you get the 1923 map from me or the Library of Va. I know I posted it somewhere. I came across it back in 2000 during research on Woodville.
I find it interesting the cemeteries, that landfill off E. Richmond Rd, and Capitol Square have figures… then there’s Oliver Hill Way near the jail which has no one living there. Odd map.
Cadeho, which map are you looking at that you can zoom in that well? I’m curious!
I can’t account for things like the jail, landfill, etc. There are a few residents of Capital Square – the folks who live in the Gov’s mansion. Maybe the structures that border things like the jail are counted? There are apartments just up the hill from there.
I’m really looking forward to seeing the 2010 census figures as regards demographics in Church Hill…thanks Magneto, your thoughts are pretty much along the lines I was thinking about what it will look like. I think Fulton Hill and Montrose Heights might show some variation, too. I could not find anything on your linked site to support those thoughts, unfortunately, but it was real interesting. Guess I’ll have to wait awhile for the results!
I think this would be an ideal topic of discussion for a community forum.
Dr. John Moeser of U or R has a report entitled Rounding up the Poor that describes how in the late 1930’s the federal government employed racist policies that concentrated Richmond’s African American population into large concentrations of poverty with a large majority being in the east end. I emailed the report to John, hopefully he can upload it as well.
My understanding of one of the implications of segregation in Richmond include that due to those policies (and others on a state, local and and private corporation & individual level) entire segements of Richmond were blighted – i.e. Hull Street, Jackson Ward, Church Hill – which have all been predominately black since the 1930’s. As a result, the property values went down, and now the areas are opportune for “re-investment”. People with money are able to fix up the property for relatively little, and the black famillies that may own homes there and have been since the 60’s are being forced to move due to rising property values.
Unfortunate and very sad. The areas blacks were forced to live in during the 30-60’s are now becoming unaffordable because they are seen as prime real estate. Ironically, as we see in these maps that these areas have remained unchanged significantly for the past 70 years.
What are the political ramifications?
@Cadeho – I don’t remember where I got, I downloaded it from somewhere what seems like a long time ago. I had it for good while before I posted it. You are the only source that I can think of, from somewhere on Richmond City Watch most likely?
So I am definitely guilty of driving past minority owned outfits to places where people look more like me (white).
Anyone have any recommendations or thoughts on food that I’m missing out on? I’m up for going anywhere and eating most anything.
“…the black famillies that may own homes there and have been since the 60’s are being forced to move due to rising property values.”
Forced? Exactly who is forcing them to move? Because some people want to preserve architecture and history & not allow time, weather, and neglect to continue? Are you actually encouraging the notion that areas of poverty should be allowed to continue to decay?
Let’s see. I take a run down property, invest several hundred thousand in it, and come up with a nice home in which to live. Doing so raises the property value of the existing neighbors, *increasing* their net worth. And by co-mingling people with different backgrounds, we also allow for new ideas on how to improve the neighborhood for everyone. So what part of this is bad?
Oh wait, that’s right. I forgot. *Change* is bad. We don’t want those who have lived for so long in impoverished areas to be allowed to improve their lives! So in order to maintain their historical poverty status, they are forced to move to another slum. Because heaven forbid they actually have the chance to live in a nicer neighborhood, with less crime, and receive opportunities that would otherwise not be available. Is that the “forced” to which you refer?
And here I thought I was helping raise EVERYONES’s ship by contributing to the rising tide! Bad me!
You may not be PC, Rick, but I hear you. I get very frustrated with the way the race card so frequently gets played in these discussions – and the way the improving homes and neighborhoods gets spun into something sinister.
I think the problem is, although there is a lot of talk, there really isn’t much co-mingling going on. My kids are still almost the only white kids at their school, and the only white kids that participate in Richmond Parks and Rec sports leagues here in the Hill.
You can call it a class divide or anything else, but most of the folks who are opining about race relations over their glass of Cabernet do not mix or mingle with the older families in this community.
I agree that this is the best way to overcome our problems. That is, to interact and live together. To make an effort to understand another culture and have empathy towards other’s needs.
Re: post # 13 Rick well said.
I must point out one thing, here on this site one would get the impression that every minority in the Church Hill/East End lived in poverty. Just not true!! The majority of residents (Both Black & White) in the Church Hill/ East End work hard to improve their community, want to preserve architecture and history, increases their property value, pleading for better schools and would like crime to go away. So let’s not forget we are one community!!
After taking a closer look, anyone know what accounts for the dark green square north of Nine Mile Road near Oakwood Cemetery or the yellow square north of Fairmount but south of Fairfield (it looks like it’s somewhere around 21st/22nd/23rd St)? I always assumed that all of the area north of Fairmount was about 99% African American, and those two squares (particularly the dark green square) are rather puzzling.
http://www.niemanwatchdog.org/index.cfm?fuseaction=background.view&backgroundid=00319
April, that little red dot is right off Midlo Tnpike. Its the loop of Brookline Street, Oak Glen St, Bogy Road, and old carnation st. Sort of the area where Warwick and Carnation st come together. Very strange… I juxtoposed a google map over the map above in Photoshop. Don’t have a public website to post it to, but i’d be happy to email it. Rudimentary, but helpful for people like myself who need a couple road and cemetary markers.
Every country deals with race differently. The two biggest mistakes in American history once one gets beyond slavery: (1) forced integration by court rulings – you can’t force people to want to associate with, get along with, or respect you; and (2) affirmative action – no matter how one looks at it, it smacks of unfairness and does not make people respect you.
What we have today are simply the long-term ramifications of bad racial policies. What is perhaps more fascinating is that many think that 50 years of legal integration has somehow negated or counterbalanced the treatment afforded blacks prior thereto.
As for the Harvard Professor incident….