RECENT COMMENTS
A look at housing and transportation costs as percentage of income
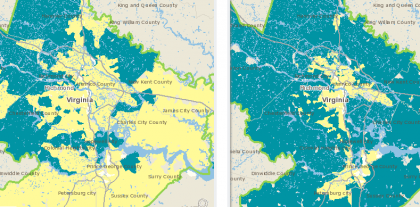
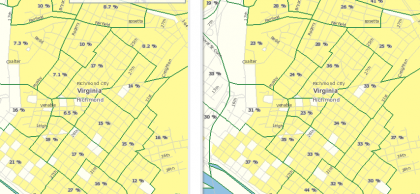
A nice companion piece to this photo, the Housing + Transportation Affordabilty Index delineates areas where residents spend a high proportion of their income on housing or housing&transportation.
The maps above and below show Housing Costs – % Income (left) and Housing and Transportation Costs – % Income (right). The blue on the left show areas where housing costs represent 30% or more of family income. The blue on the right indicates areas where the cost of housing as well as the cost of transportation associated with the location of the home is 45% or more of family income.
From the H+T Affordability Index site:
Housing Costs factored as a percent of income has widely been utilized as a measure of affordability. Traditionally, a home is considered affordable when the costs consume no more than 30% of household income.
H+T has been developed as a more complete measure of affordability beyond the standard method of assessing only Housing Costs. By taking into account both the cost of housing as well as the cost of transportation associated with the location of the home, H+T provides a more complete understanding of affordability. Dividing these costs by Representative Regional Incomes illustrates the Cost Burden placed on a Typical Household by H+T expenses. While housing alone is traditionally deemed affordable when consuming no more than 30% of income, CNT has defined an affordable range for H+T as the combined costs consuming no more than 45% of income.


Spending forty-five percent of household income for housing and transportation is considered affordable? To put that figure into perspective, look at it this way:
According to the U.S. Department of Health and Human Services, the median household income for a family of four in Virginia was $81,919 in 2009. That family would spend almost $37,000 on housing and transportation alone–no food, no health care, no utilities.
The picture becomes even more bleak, and looks less and less affordable, when you calculate housing and transportation costs for households making 60% of the median income, which is the threshold for some benefits. Imagine being in a four-person household with a total income of $49,151 per year and paying a little more than $22,000 in housing and transportation.
Add to that the average tax burden of about 40%.
I’m curious, what constitutes transportatin costs above? Car payment (s), car insurance, gas, repairs, etc.?
I first looked at these maps a couple weeks ago and wondered many of the same things
#1 The regional median household income used in this calculation was $46,800. I believe a family of four constitutes roughly 20-25% of the housing demand so they were not the driving force statistically. But, if you were to make a map of housing + transportation + raising two children and apply it to that specific demographic you would probably find it blue as well.
#2 I think the household income is post tax – I might be wrong though.
#3 Clicking around on their website I found that transportation cost was the sum of cost of auto ownership, cost of auto use and cost of public transportation divided by the median household income
Most important information derived, for me at least, are two things. Suburban development is not financially sound for residents and their local gov’t. and secondly, the phrase “drive to you qualify” inherently puts those at the greatest risk the farthest away from jobs, transportation options and the coutless other amenities and support systems that more densely populated areas afford.
Americans will pay an average $2.92 a gallon for gasoline this summer, 20% more than in summer 2009, the Energy Information Association says. “The boost to gasoline consumption from the economic recovery is being countered by higher gasoline prices compared with last year,” the report says.
—
Nearly two-thirds of Americans think the time is right to buy a house and nearly 70% view home ownership as a relatively safe investment, according to a Fannie Mae survey. However, 60% believe that buying a home today is harder than it was for their parents, and 68% think it will be even more difficult for their children.
—
“The new foreclosure wave is here,” CNBC’s Diana Olick says, expecting a monthly record when the numbers come out next week. “And this is just the beginning…”
—
Road zombies!
http://www.treehugger.com/files/2010/04/road-zombies-extreme-commuters-3-million-usa.php
—
National Survey Shows Americans Broadly Support Investments in Public Transit, Walking, and Biking (pssst…someone let Henrico ‘leadership’ know)
http://www.treehugger.com/files/2010/04/t4a-national-survey-americans-want-more-public-transit-biking-walking.php
Very interesting stats! I believe North america needs better mass transport. Commuting is killing our economy, social life (and nerves). I much better enjoy reading a book or talking to a neighbour in suburban train or subway, than driving a car around the same corners 500 times a year, no matter how comfortable sitting or standing there is. Being stuck in a traffic jam is so unproductive! But this is going to be a long run…
Julie
I remember seeing a report last year that showed Richmond as one of the most car dependent cities in the country. Obviously this ties directly to poor public transit and inefficient planning. It’s also worth noting how it’s related to obesity.
I had asked before about how many people that live in the Hill bike to work and what routes they use. I’d love to see more downtown workers make the choice to move closer to work and use their cars less, even if they decide to carpool. I have yet to meet anyone in Richmond who carpools, unless it’s for their kids going to school.