RECENT COMMENTS

East End loses residents as city population climbs
There were approximately 27,367 people living in the East End of Richmond in 2010, down from 27,743 in 2000.
| Tract | 2010 | 2000 | 1990 |
| 201 | 1,669 | 1,716 | 2,029 |
| 202 | 3,811 | 4,238 | 4,202 |
| 203 | 1,630 | 1,889 | 2,013 |
| 204 | 5,115 | 5,520 | 5,311 |
| 205 | 3,851 | 2,262 | 1,764 |
| 206 | 1,533 | 1,540 | 1,519 |
| 207 | 1,155 | 1,276 | 1,471 |
| 208 | 1,410 | 1,714 | 1,823 |
| 209 | 2,619 | 2,949 | 3,209 |
| 210 | 1,567 | 1,638 | 1,605 |
| 211 | 1,432 | 1,396 | 1,145 |
| 212 | 1,575 | 1,605 | 1,559 |
| 27,367 | 27,743 | 27,650 |
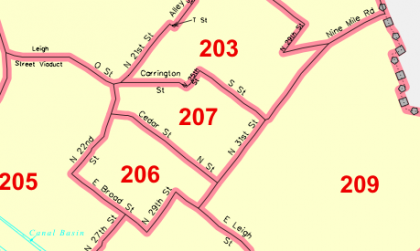
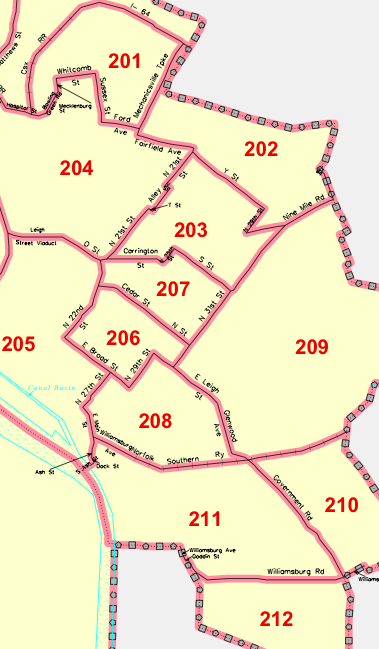
For the sake of the math, this tally includes the 12 census tracts in the city east of I-95, south of I-64, and north of the James River (map PDF or see below).
The 2000 Census data showed Richmond as having 197,790 residents, down from 1990 (202,798) and 1980 (219,214). The recently released data for 2010 puts Richmond’s population at 204,214.
During the last 10 years the city population increased by 3.25%, the population of these 12 tracts decreased by 376 people. Tract 205 which includes Shockoe Bottom and Tobacco Row saw an increase of almost 1,600 residents; the only other tract to see any increase was 211 (Fulton) which gained just nder 40 people.
Census Tracts 201-212 (1990/2000/2010)

TAGGED: census


Any thoughts on the reasons why? There are far fewer vacant properties all around the Hill then there was back in 2000. Also, the addition of Nolde and St. Patricks are a few examples of an increased headcount in a small footprint. Gentrification in large portions of the Hill could be the reason. Homes that once housed many people just have one or two people in them now.
It’s Buffington and Wine’s fault.
Hey John Murden, is there detailed info available? I’m interested in the demographic breakdown by tract, with further data, which I think I saw about the 2000 census at some point. Have I missed something in the links? Or is the detail not available yet? Thanks.
And is there going to be a redistricting for council districts, or not, do you know?
Well played, @eclk.
I still need to get out there and try some of that delicious-sounding food.
Could the decrease be caused at least in part by the conversion of multi-unit rental houses back into single family properties?
#2 Elena:
I would think, as you said, it would have something to do with the gentrification. It does seem odd, though, that within the past 10 years there has been a marked reduction of empty/abandon properties yet there are fewer people.
I agree with #2. My hunch is household size has decreased. Even though previously vacant/abandoned houses have been rehabbed, it can’t completely compensate for the larger size households (with children) which have moved out of the area as empty nesters and young urban professionals have moved back. As the Census releases more data in the coming months, I suspect most of the decrease for our area will be within the under 18 crowd with some additional loss in the elderly (age 65+) crowd.
@ # 4 – Here is where you can access the Census data: http://factfinder2.census.gov/main.html
The Census Bureau recently reconfigured their FactFinder website for the release of the 2010 Census data, and I’m still having difficulty navigating it. Good luck!
There will be a redistricting for council districts; it’s required by law with the release of data from each decennial Census.
I saw a couple months ago a very detailed plan/PDF for revitalization of East End, 25th and Broad and points north of there. I can’t remember what the project was called but has there been any headway or progress?
It was referenced in the Church Hill Newsletter…
376 is a pretty small difference . I wonder what the margin of error is in the counting of people?
#9 Magneto many thanks.
@ # 11 – There actually shouldn’t be any margin of error since this was sent to every household in the United States – a 100% count. You’d get a margin of error if the questionnaires were sent to a sample of all households. There will obviously be some need for adjustment to account for difficult to count populations (e.g. the homeless, non-responders, etc.).
The following link provides more details. Just type in the zip:
http://www.washingtonpost.com/wp-srv/special/nation/census/2010/index.html?tid=grpromo
I agree the population drop is due to decreased household size. I was told our house was previously occupied by a family of 9. Now it is just me, my wife and my dog (hard to imagine 9 living in our little house).
I’m wondering what the true rate of return was for our area? Guess we’ll never know.