RECENT COMMENTS

Black population in East End down 15% since 2000
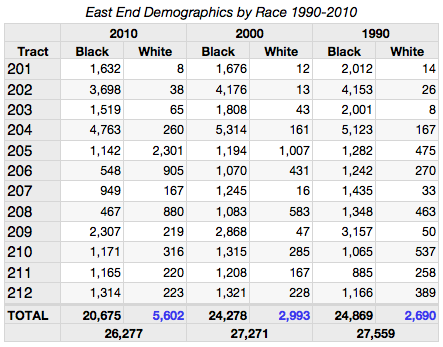
While the population of the city rose between 2000 and 2010, the population of the East End dropped slightly. Over the past 10 years, the black population in the area dropped 15% and the white population rose 87%.
The rate of loss in black population in the East End is nearly double the city average. According to the Weldon Center, Richmond had the largest shift in percentage of black population in the state, losing nearly 10,000 or 8.6 percent between 2000 and 2010. Despite losing almost 4,000 black residents over the last 10 years, the East End is still 75% black (20,675 of 27,367).
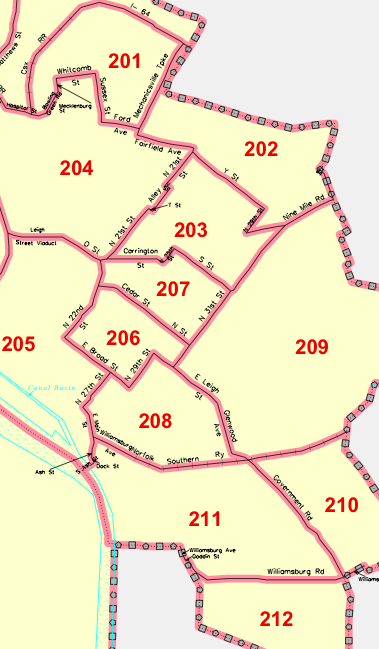
The biggest losses are in census tracts 206, 207, and 208 – the bulk of Union Hill, Church Hill North, and Chimborazo. The most dramatic white growth is 205, 206, and 207 – Shockoe, Union Hill, and Church Hill North.
Census Tracts 201-212 (1990/2000/2010)

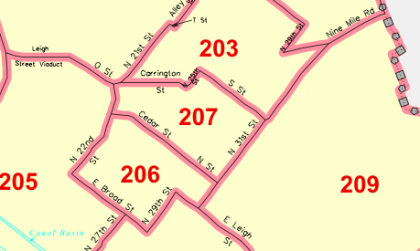
For the sake of the math, this tally includes the 12 census tracts in the city east of I-95, south of I-64, and north of the James River (map PDF).


Can anyone say ‘gentrification’? A completely predictable and orchestrated process.
A change in demographics to more accurately reflect the general population of the state or region is not on its face a bad thing. High concentrations of any race within a fixed area, however, is a sign of segregation, whether forced, by choice, or, equally shamefully, by economic stratification. I’m hopeful that this shift is more a sign of healthy racial integration than the overused term “gentrification” would indicate.
Also, I really like the way the census tract graphic looks like there’s a fortress wall with buttresses and towers around the City. I’d like to see that built after the new coliseum is finished. You know, to keep out the county riff raff, Huns, etc.
John, do you have any stats on the median income over the past 10 years?
A comment on this post from Facebook:
I’m not sure that data in and of itself can be racist. Is there a sense of either lament or celebration to my post? The changes are what they are, and are worth noting.
I had 2 area residents, a white man and a black woman, forward pieces to me about the changing demographics of the city. I read articles about the changes in Richmond in the Richmond Free Press and the RTD. These, and a desire to see how this was reflected in our area, were my jumping off points.
Thank you for posting this John. I think it is interesting and a 10 year census update is VERY appropriate to the site. The facts are the facts, don’t shoot the messenger.
Both John and CHPN.net are da bomb. It’s a great site; very informative and interesting. Am not a huge fan of these type of posts though. I have a sense of lament with this one….
I’ll get over it….
“It has fumes of racism to it”? It’s census data for heaven’s sake! Jesus! No wonder the city can’t seem to get over the whole race thing. People who bring up the fact that census data “has fumes of racism” keep perpetuating the issue! Get over it! It’s data!
Can’t bring more wealthy people into a neighborhood without being racist. Can’t report crime without being racist. Can’t post census data without being racist. Really? Is that what the world is coming to? Grow a pair and stop being so sensitive. This is a local news website, and a fluctuation in the area demographics is news. I see this as a positive trend. The East End was once almost all black. Now, we are moving to a more mixed race neighborhood. I would like to see this area become half black and half white one day, along with all areas in the city. If you want less racism and more progress, you just need to mix it up a bit.
@ #4 – The Census Bureau eliminated the Long Form Questionnaire from the Decennial Census. The Long Form included questions on income and other more-detailed statistics about the householder (travel time to work, house heating source, age of house, etc.). The Long Form has now been reassigned as the American Community Survey, which contains the same questions and is sent to a sample of households within each locality on an annual basis. The drawback to this is that the sample size is so small that the Census Bureau has to average out the responses over a 5-year period in order to represent the data within a reasonable margin of error at the Census Tract (the boundary map John included in his post) level.
The first 5-year average of the American Community Survey was released fairly recently. You’ll want to refer to the Census Bureau’s American FactFinder website: http://factfinder.census.gov/home/saff/main.html?_lang=en They recently updated the website – I haven’t completely familiarized myself with their new design, but at first glance it looks like it sucks, so I recommend sticking with the link I just provided which is the older version. You’ll then want to place your mouse over “Data Sets” and then click on “American Community Survey” in the box that appears. The 5-year estimate should be your default selection on the next page. Click on “Detailed Tables.” From there it’s a matter of narrowing down to the Geography you’d like to view (e.g. Census Tracts in the City of Richmond) and then identifying the table of interest (I recommend searching by subject).
I hope that helps!
In today’s world, people have become accustomed to reporters with an agenda. It’s rare that you can find news outlets who will just report the facts without spin and even the choice of what makes “the news” is often heavily politicized. John, I think you are one of the last true reporters left that covers a topic I care about. It’s refreshing to be able to read well presented facts without being told how I am supposed to feel about it by my reporter. I think this may be shocking to some who assume that your choices of what you include indicate some sort of implicit endorsement.
Please don’t change a thing. Keep bringing us all the news that’s fit to print and letting us decide what to make of it.
To your critic – Get a F’ing Life! Statistics are just numbers and like them or not, they are what they are. Hurling charges of racism at a reporter who is just telling facts is chilling. Would you rather live in a country where your media is carefully controlled? Should John only report stories that fit with whatever storyline you approve of and ignore the rest? Sounds Orwellian to me.
Interesting info.
As someone who has been in the journalism business professionally for 19 years, I can attest that John M.’s approach to this story and his use of statistical information is very important and helpful information. Nice presentation as well. No racism at all. I spend enough time checking CHPN to know better.
@#5, a/k/a/ the facebook poster: the white guilt/sensitivity is deafening. Move on.
Good job, John. To the people crying “gentrification,” are you saying that you think people should be segregated? Or do you even know what you’re trying to say?
@#5 Me thinks the man doth protest too much.
Hi John. Thanks for gathering this information. BTW readers, I am the “black woman” who was interested in knowing these stats after reading this article http://www.richmondfreepress.com/news/currentPageA.pdf in the “Free Press.” There is nothing racist about John’s stats or the stats published in the “Free Press” – they are simply facts. What I do find significant is the percentage of blacks who have moved from the City to the surrounding counties – as noted in the “Free Press.” City-wide the statistics really do have a story to tell. And it has nothing to do with gentrification – it has more to do with middle class blacks escaping crime, higher taxes, and schools where it’s hard for children to learn because of so many other distractions. Believe me. I live it; I know it. As a parent, I sometimes regret staying in the City raising African American children, especially my son. I’ve heard the strong survive; but sometimes it is very, very hard to remain strong when there is so much hopelessness in the mist.
Again, thanks John for breaking it down for the Church Hill area.
If there had only been 1 person of any race and another person of the same race moved in, one could have said the population doubled. Mathematically correct, but not accurate as to the real effect of the doubling of population.
Calculated another way:
2010: 21.3% white
2000: 10.9% white
The net change is 10.4% as a percentage of the entire population of the census area.
“There are lies, damned lies and statistics.”
Mark Twain
CordieB is right on. There seems to be plenty of affordable housing options in the East End so I do not believe gentrification is the culprit in this situation. Blacks, especially those with children, seem to be seeking “better” lives in suburban areas. Very similar migrations have/are occurring in cities like Washington, D.C., and Atlanta (cities possessing a large black middle class). It’s not surprising to see this happening in RVA.