RECENT COMMENTS
Assaults, shootings, and homicides (2000-2012)
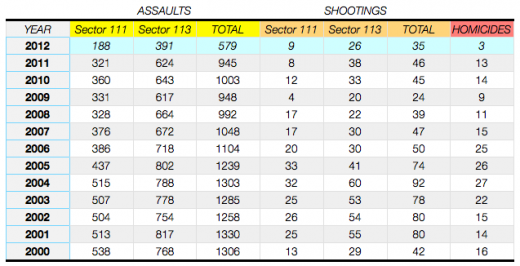
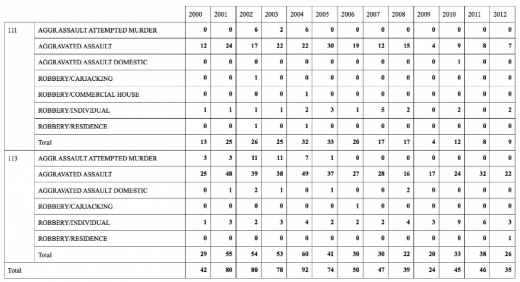
As the area’s homicide rate has dropped in recent years, a persistant question has been how much this drop is an accurate representation of the level of violence in the area. Towards getting a more clear picture of what is going, I’ve compiled the stats on assaults, shootings, and homicides for Sector 111 and Sector 113 going back to the year 2000.
Sector 111 is the area south of Nine Mile and Carrington, and includes Union Hill, Church Hill North, Chimborazo, St.John’s, and Fulton. Sector 113 is the area north of Nine Mile and Carrington, and includes Fairmount, Mosby, Whitcomb, Creighton, Fairfield, Brauers, and Woodville.
The numbers for 2012 are through August 27.
Before 2008, the combined sectors were averaging 1,234 assaults per year. For 2008-2011, they averaged 972. The highest count of assaults was in 2001, with 1330 assaults between both sectors. This year, 2012, is on track to be the lowest in the 12 year span, with a projected full-year count 869. The last 3 complete years have the lowest number of assaults during the span (2,896), a rate 75% that of the the 3 year span of 2000-2002 (3,894).
Before 2008, combined sectors averaged 68 shootings and 20 homicides per year. From 2008-2011, they averaged 39 shootings and 12 killings per year.
Assuming a connection between the number of shooting and the number of homicides, there are perhaps some tendencies to observe. Over the 12 year span, there has been on average about a 3 to 1 ratio of shootings to homicides. This year we are seeing an almost 12 to 1 ratio, an incredible number indicating that VCU or luck or both are keeping the homicide rate down. 2006 was the unluckiest year, with a 2 to 1 ratio.


Thanks for posting these numbers, John. One question I have is what is the actual crime rate. What is the population of the sectors during each of those years? Has it gone up or down significantly, or has it remained steady? That would tell us the number of crimes relative to the number of total people.
Nicely done. So it seems shooting is down but murders are WAY down. Good news both ways.
Shame we can’t get stats on bullets fired in the shooting. Maybe it’s a case of bad economy->bullets cost money->no more gratuitous firing multiple rounds? 😉
@Jesse – There were approximately 27,367 people living in the East End of Richmond in 2010, down from 27,743 in 2000. This tally includes all of the development along Main Street, which is in Sector 112 and so not included in the crime statistics above. Taking those apartments/condos out of the picture, the population covered above drops by another 1,000 or so – a 5% decline in population over 10 years.
I would imagine some of the decline is rooming houses that have been converted back to single family homes?
Thanks for the population numbers. That helps. The number that blows my mind is the 39 assaults YTD 2012 in Sector 113, where there were 624 total in 2011. That’s amazing.
That’s a typo, should be “391”. I’ve made the correction above.
@4 – the decline is somewhat driven by the cumulative impacts of the arrests for all the crime over the years also I’d imagine. Even assuming some duplication, some amount go unsolved, there’s hundreds of arrests made each year on these crimes.
We aren’t done with 2012 yet though, if you forecast the numbers assuming the same trends til the end of 2012, we would end up with a drop in assaults and murders, but shooting would be the same as last year and that’s the crime that worries me the most because there is almost nothing you can do to protect yourself from a random stray bullet.