RECENT COMMENTS

Richmond is the 39th most racially segregated city in America
A piece tying together historic housing policies and current events in Ferguson, Missouri, links to a study by John R. Logan (Brown University) and Brian J. Stults (Florida State University) on segregation in American cities.
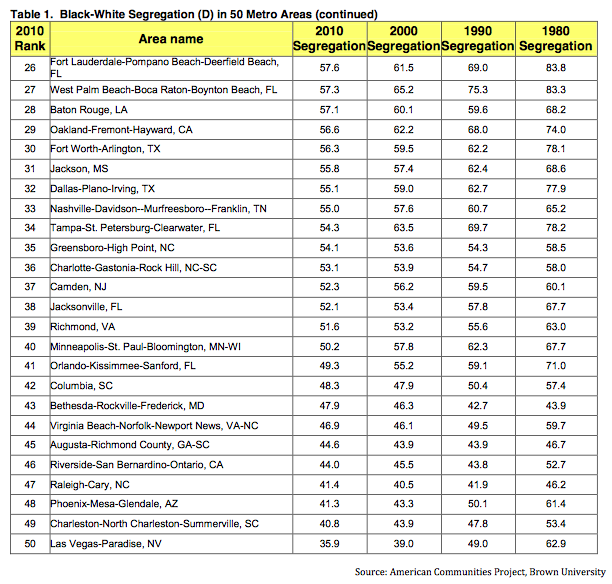
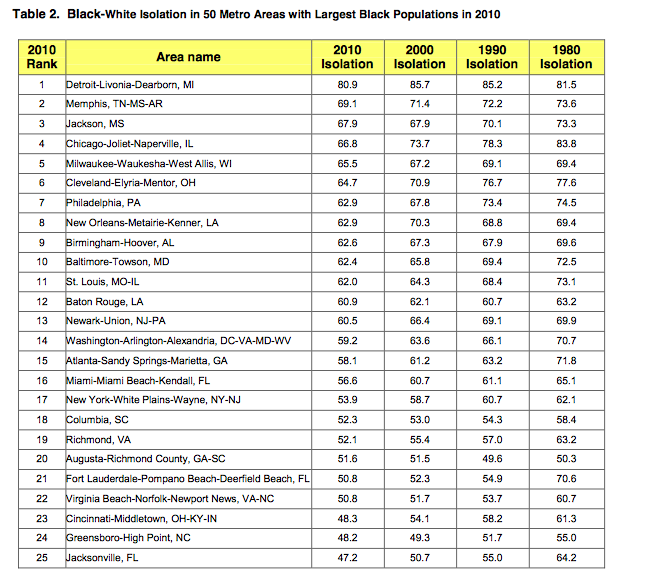
Among the 50 metropolitan regions in the country with the largest black populations in 2010, Richmond is listed as only the 39th most segregated. Richmond is also listed as having the 19th highest level of isolation, which describes “the % minority in the neighborhood where the average minority group member lives”. This seems more of an accurate measure of what has been the typical neighborhood experience in the city.
Some of the parts from the study which jumped out:
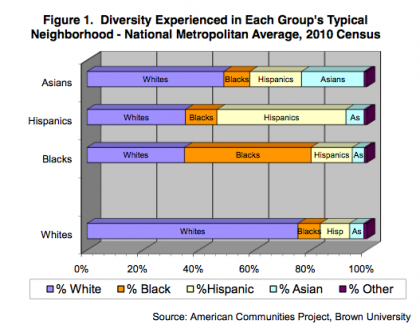
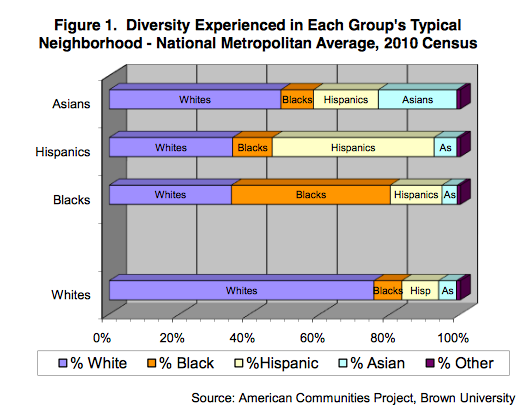
In 367 metropolitan areas across the U.S., the typical white lives in a neighborhood that is 75% white, 8% black, 11% Hispanic, and 5% Asian. This represents a notable change since 1980, when the average whites’ neighborhood was 88% white, but it is very different from the makeup of the metropolis as a whole.
The experience of minorities is very different. For example, the typical black lives in a neighborhood that is 45% black, 35% white, 15% Hispanic, and 4% Asian.
— ∮∮∮ —
Note that at 51.6, Richmond is approaching a level of segregation that “social scientists consider the moderate range (under 50)”.
Large Southern cities provide examples of persistent segregation: Birmingham, Memphis, and Baton Rouge fit into this category. But others have seen improvements – and Atlanta is the outstanding example, having experienced more change though it still falls among the top 25 on this list.
Another way to assess segregation is by level of isolation (i.e., the % minority in the neighborhood where the average minority group member lives). … What is most striking about these figures is that with very few exceptions, the Isolation Index is above 40 in the largest metro regions. African Americans live in neighborhoods where they are an absolute majority, or a near majority, in most of these places.
— ∮∮∮ —
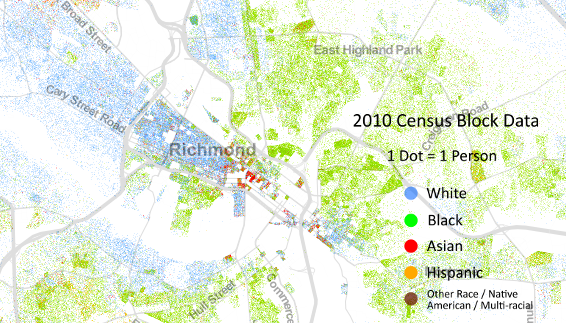
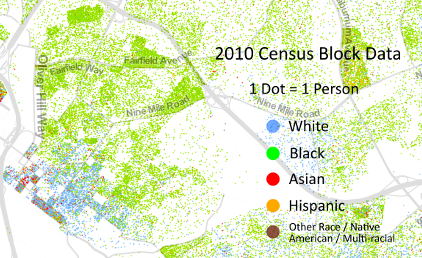
It’s difficult not to think of Richmond as segregated, even as the city’s population as a whole kind of shakes out. The concept of isolation is apparent in the details from Dustin Cable’s map of the United States based on the 2010 census data. There are very few places in the city that don’t seem to be either black OR white.
— ∮∮∮ —
The patterns on the map don’t seem that different than 1946.
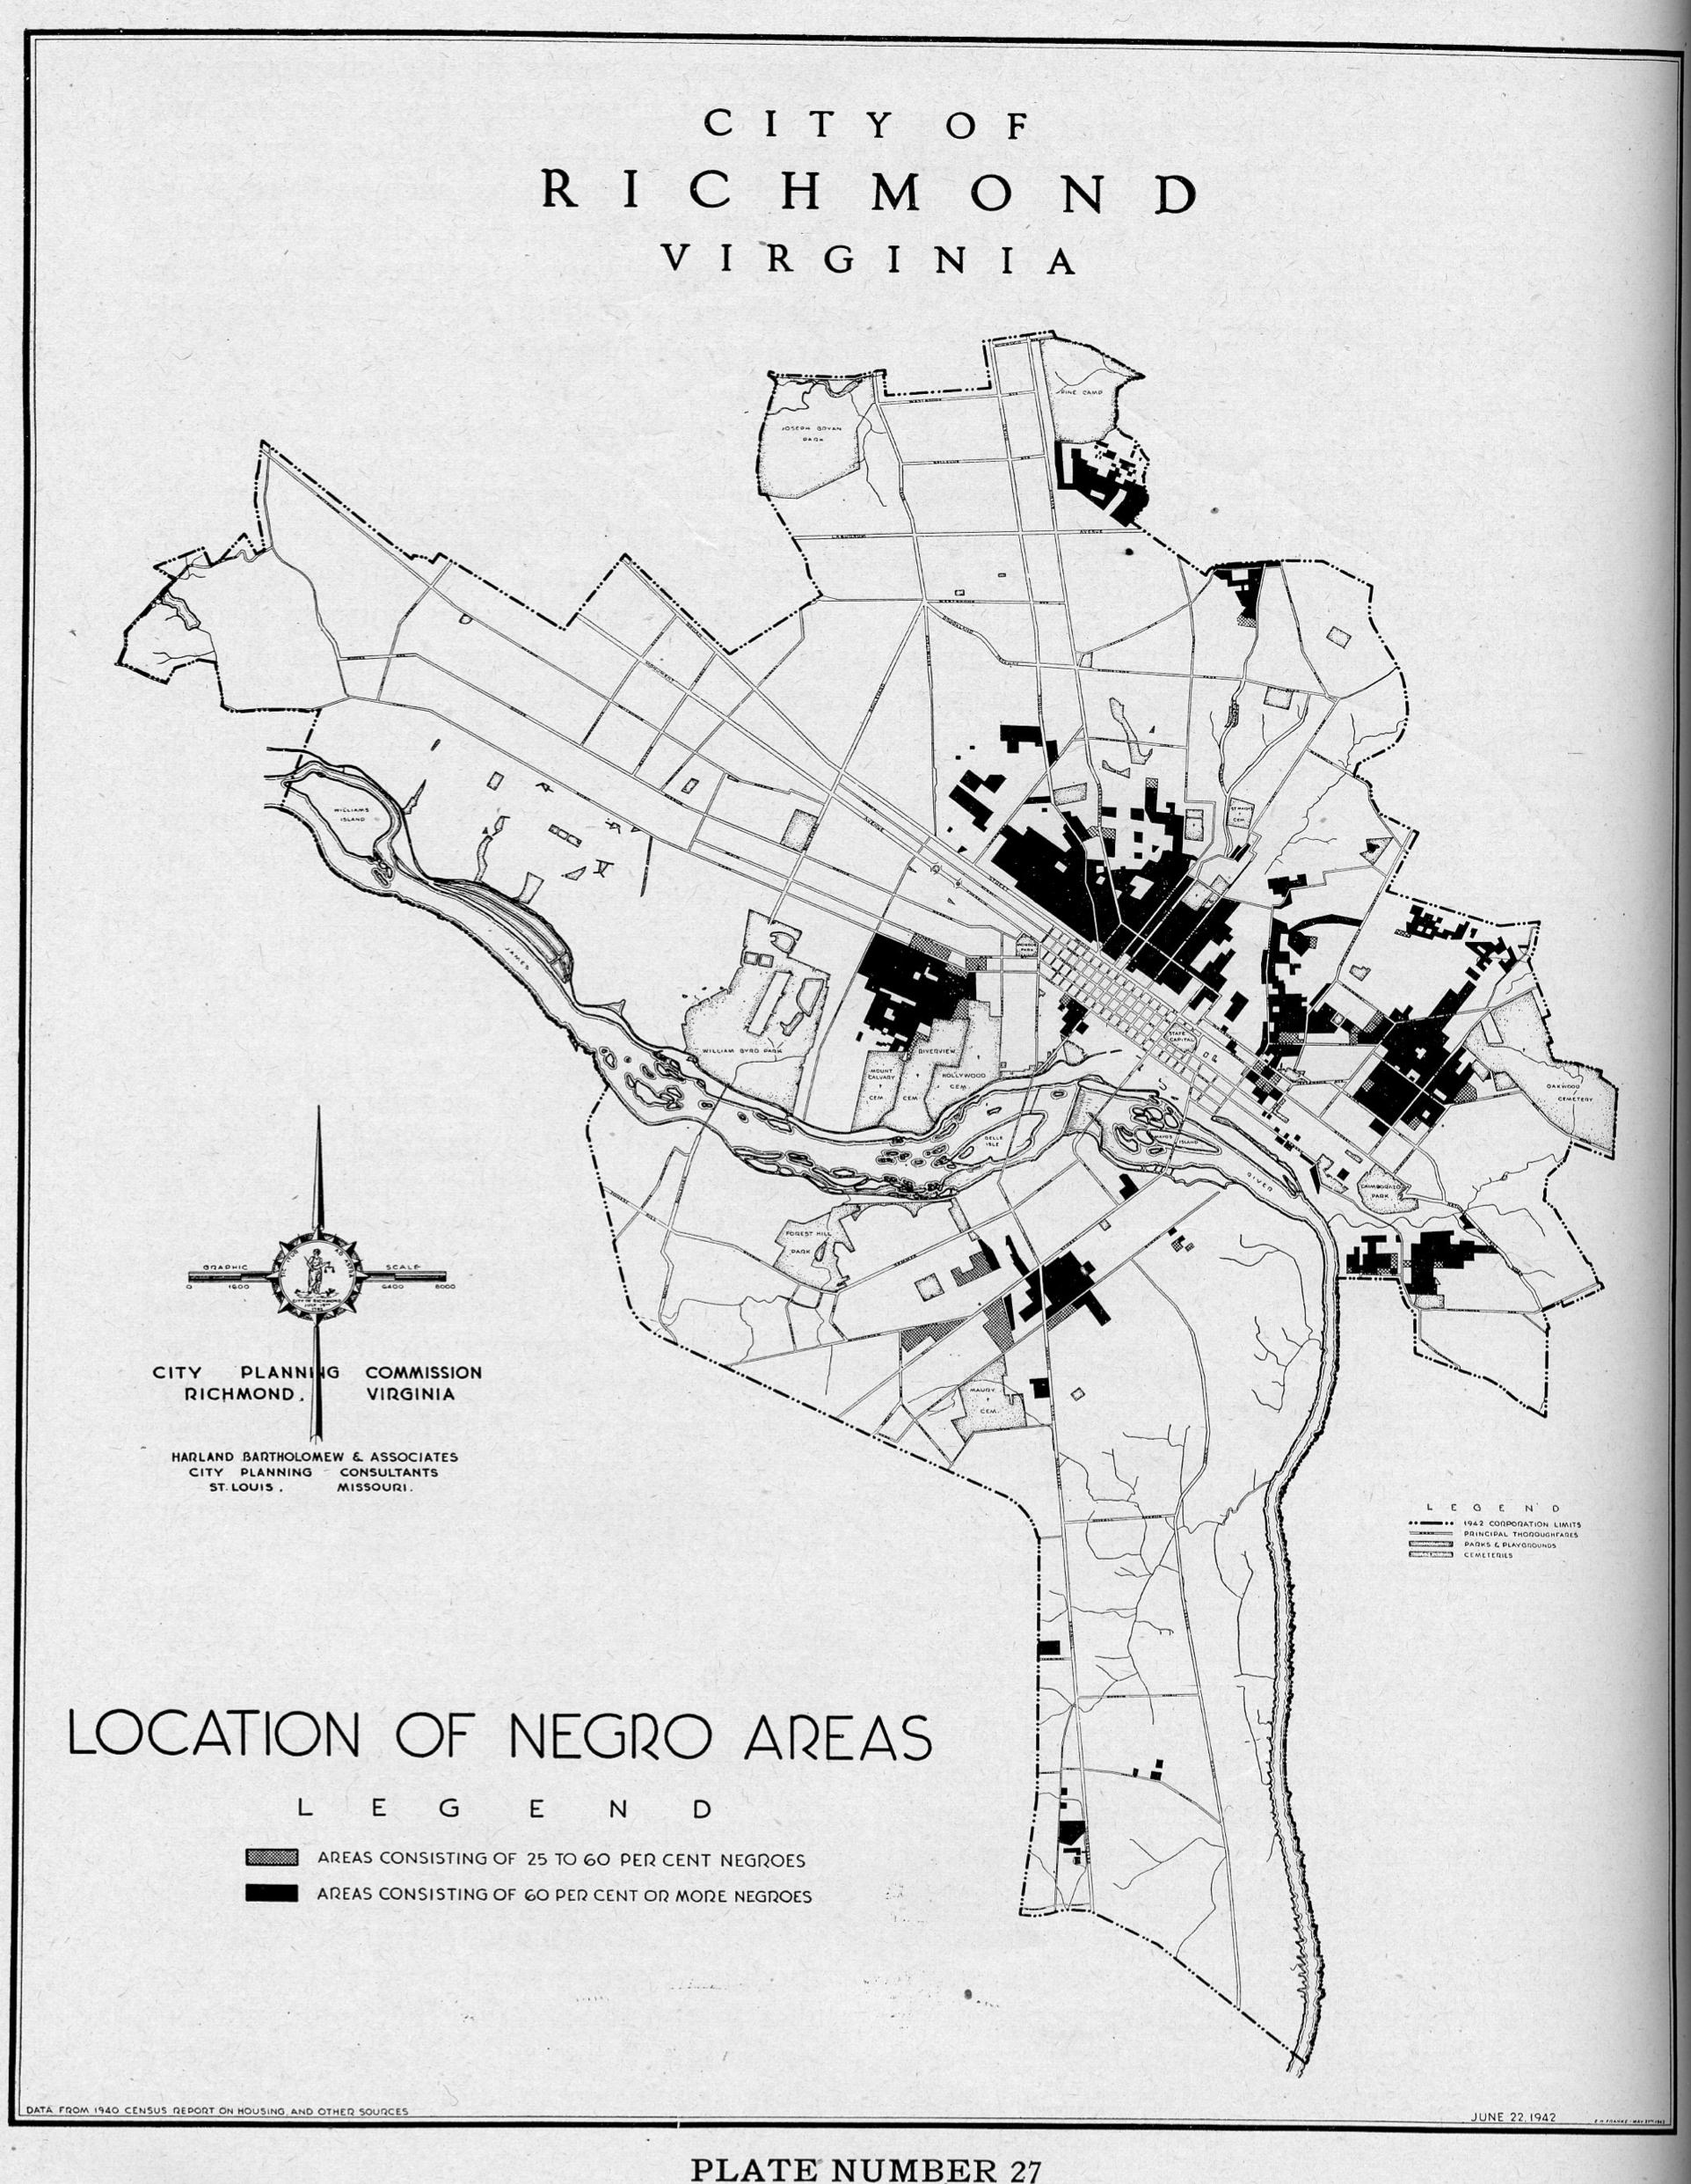
“Location of Negro areas” (Bartholomew’s 1946 Master Plan)
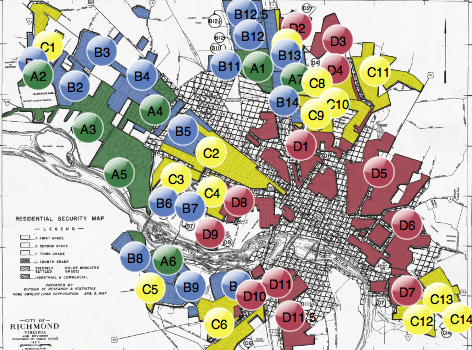
“Residential Security Map” (Redlining Richmond / 1937)
It is no surprise that Church Hill is somewhat segregated nor that it was highly populated in the past by African-Americans. East sides of town in many cities are majority black, or at least the ones I have lived in. This is sad that in the 21st century we still live in such situations. The riots in Ferguson reminds me of the race riots of the 1960s in which I lived through and saw first hand growing up in Newport News.
I mentioned in the past that there are still those in our area who swing far on either side meaning racial tensions still exist It is one of the reasons for the “no sale” of Charlie Johnson’s buildings until he passed on and still an obstacle with the historic 401 N 27th building. It was heard on the street as it was being said so know that is the case.
To me 50% is still falling way short.
Where I sit typing right now has almost exclusively black neighbors to my north, exclusively white neighbors to my south, and I’m in the middle with everybody. I do also wonder if the Hispanic communities of Richmond aren’t the most segregated of all. Demographics south of the river would probably paint a different picture than CH or Northside….but regardless, it’s economically driven and at least not legislated anymore. That “Map of Negro Areas” is disturbing.
Fascinating post, thanks John.
I am so glad you posted this! I’m a native Missourian. Having lived there for 30 years I can say that what’s happening in Furgeson was inevitable and racism is not on only alive, but it thrives there. And also if you’ve been following any of the social media, please do not judge me by so many of the awful things being said. But those things paint an accurate picture. Being from Missouri I have been following closely and it can make my blood boil at times and also make me very ashamed of how far my home state has NOT come. The Furgeson PD has a history of complaints of racial profiling and the numbers seem to support it. This situation erupted, I believe, due to a very poor relationship between police and the community. Officers there don’t interact with the residents outside of arresting them and it creates a lack of respect for authority. This is true for poor as well regardless of race. It’s not difficult to see why they don’t feel like they are valued as humans.
These numbers are really interesting because if you look at comments on social media from news outlets there versus here, it’s a different tone entirely. I can’t say for certain having not been here as long and I’d love if someone could maybe elaborate, but there doesn’t seem to be the same tension or hate toward police here. From what I have seen our officers are much more involved outside of just responding to calls.
I believe the racial divide goes much further than the disparate arrest/incarceration rates for black vs white. I really thinks it starts at the middle school and highschool level. I feel like the RPS schools basically “throw away” generation after generation of young black men. Instead of educating them, they suspend them. Or send them to the “alternative school” – which is full of kids just out of juvenile detention, because that is where they go. We need to hire teachers that can teach kids with emotional issues, not just remove them. And we need to stop the over-use of suspension. No one should suspended unless an act or threat of violence has occurred. Try in-school suspension, hire and pay qualified and compassionate teachers. Look at the drop out rate for Richmond schools and the lack of opportunity and the bleak future for these young people. How can we expect kids with no hope to rise above the violence and crime in the neighborhood?
tiny, what you are speaking of is in part generational. I don’t know how old you are but I can remember when I attended elementary school discipline was still allowed. You were sent to the principal’s office first for a paddling then detention to write 100 times or more “I will not…”. And of course, having to get your parents to pick you up for having to stay behind while missing the bus.
Teachers knew their stuff then and were no nonsense. Classroom sizes were smaller and there was a lot of interaction with one another like singing, dancing, playing instruments, sharing art supplies, etc… in a single class up until the 8th grade rather than going from one teacher to the next until you are in upper grades.
With todays society it is “do not touch” rather it be teachers or students… negative teachings for being social (more teaching to be anti-social). Kids get to dress any old way now. In my day there were NO t-shirts, NO shorts, NO sandals, NO odd hair, etc… It was all a part of self respect, social interaction respecting others, and again, discipline. Not the all about ME society and parents being “friends” rather than being “parents”. Who is raising who these days? Reminds me of those horror films from the 1960s where children were demon possessed and controlled the adults.
Then you have younger teachers now that lived part of their life under these new order rules so they are limited with what they can do. Teachers are just as bad as the kids they teach – not skilled with social interaction having been born during the computer age. They lack knowledge skills as well. And classes are overcrowded so there are many kids overlooked who needs extra help.
This is really informative and interesting. Thank you for sharing it. I was dismayed when I read the title though as there are nearly 20,000 cities in the US. It took me a second to realize it was out of 50. Lots of work to be done.