RECENT COMMENTS

Crime down in 2014, but up in some areas
After what seemed like rash of property crimes across a swath of the area to end the year, I was curious to see how this year’s numbers for the East End compared to last year.
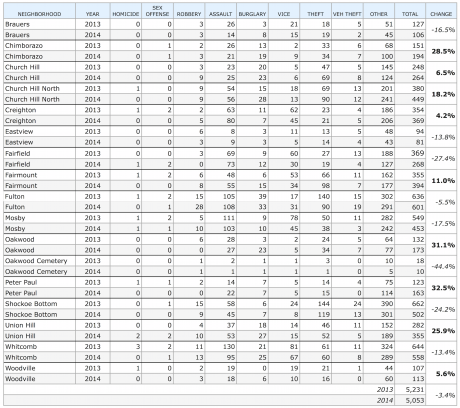
I pulled the “ALL CRIME TYPES” data from the Richmond Police Department’s Crime Incident Information Center for the period of January 1 – December 31 for 2013 and 2014 for the 17 neighborhoods that are covered to some degree here on CHPN.
Short answer: the total number of reported incidents is down about 3.4% (from 5,231 in 2013 to 5,053 in 2014). Notably, while there were 10 homicides in the East End in 2013, there was a historic low of 4 in 2014.
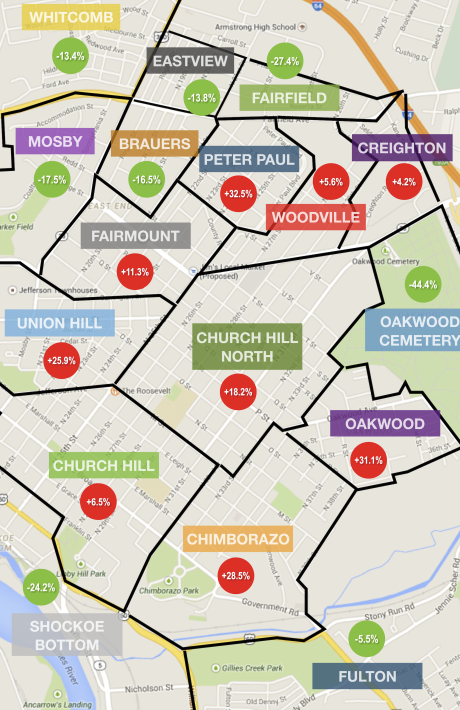
This drop in crime is not even across the area, however. The number of incidents in Fairfield, Mosby, and Whitcomb is way down – over 18% (to 1,279 from 1,562). Chimborazo, Church Hill North, Oakwood, and Union Hill, however, have collectively seen an increase of just over 19% (from 945 to 1,171).
Neat fact from the most recent New Visions Civic League meeting: the rise in total numbers for Fairmount is almost completely accounted for by increased reporting in shoplifting from the Family Dollar at 25th and Fairmount.
I looked for neighborhood population numbers, but was not able to find a reliable source. If anyone knows where to get that information, please let me know.
— ∮∮∮ —
— ∮∮∮ —


My master’s degree is actually on crime mapping. If you have the data handy, there’s a number of ways to do population, but it’s a lot more treacherous to do than you’d think.
Raw numbers of various crimes are of some value, but comparisons in any neighborhood-to-neighborhood way require inclusion of population data (numbers of persons, rising or declining population, age breakouts, and other demographic factors) to have real meaning (particularly for trend tracking).
Also, is it possible to get more details on that “Other” category? Given that “Other” is half or more of most crimes in most neighborhoods, I’d really like to know details of crimes and numbers lumped together in that too-broad category.
Michael Bacon is absolutely right: Mapping of crime data to tell a story can be far more “treacherous” and just plain more complex than running numbers through any GIS software.
I get what you’re saying, but I don’t think the demographics of any of the individual neighbors have changed enough for 2013 to 2014 to invalidate the year to year comparison.