
RECENT COMMENTS

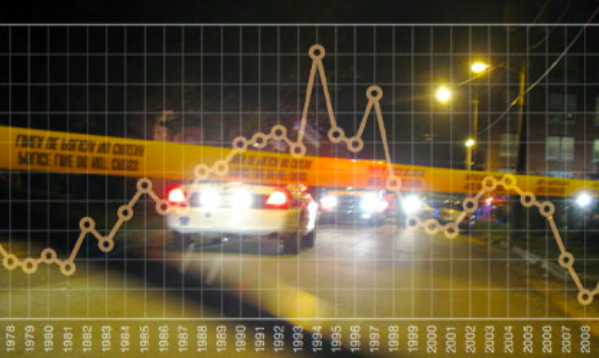
On murder in Richmond (1971-2010)
No one was killed in Richmond in June 2010. Going back to at least 1980, Richmond has only had three months without any homicides. Each of these quiet months has come in the last 8 months, and 2 of them have come in 2010.
— ∮∮∮ —

— ∮∮∮ —
Until 2008, 1981 had seen the fewest killings in Richmond since 1971 (with a count of 51). The number started rising in the mid-1980s and jumped to 100 in 1988. The yearly toll stayed over 100 for 10 straight years, hitting 161 in 1994 and 140 in 1997. The count dipped back into the 70s, jumped towards 100 in 2004, and has fallen dramatically the past 3 years. The historic low of 32 was achieved in 2008, with 2009 close behind with 39. This drop has given Richmond something previously unseen: the month without any homicides.
In the first 28 years for which there is monthly data available, there was not a month in Richmond without someone being killed. Last year (2009), with 39 killings, saw no homicides in November – the first month since at least 1980 with no killings. Since then, Richmond has also had the quiet months of February 2010 and June 2010. After going 28+ years without a break, the city has seen no murders in 3 of the last 8 months. In the past 366 months, only 3 have passed without a killing, and all 3 have come in the last 8 months.
On the way to a devastating body count of 161, 1994 saw 2 months with over 20 killings, and only one month in the single digits. The violence peaked in August 1994 when 25 killings left someone dead almost every day of that month. There were more people killed in July and August of 1994 than in all of 2008. There were more murders that April than in the first 6 months of 2010. There were more murders that year than in 2007, 2008, 2009, and the 1st half of 2010 combined. It was rough, to say the least.
So far in 2010, Richmond has seen 19 murders (6 of which have come in the East End). This is the best start to a year for the 30 years that monthly records are available — ahead even each of the last 2 record-low years at this date, and a whopping 59 better than 1994’s count of 79 at the end of June.
— ∮∮∮ —
")
NOTE: 2008 shows 36 homicides. This was later revised to 32. The 31 homicides showing in the RPD database show no killings in May, Aug, and Dec 2008. 2009 shows 41, this was later revised to 39. (update 2/1/2015)
— ∮∮∮ —
The Richmond Police were able to provide a chart showing the killings per month covering the years 1980-2004. The RPD’s online Crime Incident Information Center and the Richmond-Times Dispatch’s online Homicide Report have data for the following years.
I would like to further look into which areas of Richmond have seen these amazing drops in violence over the past decades, but the data required isn’t readily available. The Richmond Police Department has said that they can get the data, but that it will cost between $2,500-$3,000 to pull together the pre-1998 information (as it not held electronically). This is way outside of my capability to self-fund. If anyone reading this has a compelling interest and a happy checkbook, please contact me.
Great reporting, John. This is the kind of news MSM won’t report either because of lack of time or lack of interest.
Agreed, great reporting!
Thanks for this presentation, John. I’d add to Houdon’s comment the fact that MSM doesn’t believe positive news sells enough papers/hits to justify spending much time on it. The “If it bleeds, it leads” rule still seems to apply. Hopefully that’s something hyper-local media can change.
Just realized that the current 48 day stretch without a homicide in the city is the longest since at least 1980. Amazing!We’ve gone 38 days without a homicide as of today, which ties the streak from February 2010 AND the streak from November 2009.
Out of curiosity, I crunched these numbers into the annual murder rate (FBI uses incidents per 100,000 population). The results are pretty striking, even adjusted for population.
GRAPH: Murders per 100,000 1980-2009 (Richmond, Virginia)
DATA: Murders per 100,000 1980-2009 (Richmond, Virginia)
Excellent! I’ve pulled in Taber’s table & graph:
I find this data hard to believe. Working at MCV, I saw alot of people the last couple of months that died of either stabbings or gun shots. Not sure if they were flown in from other areas though. I see victims of gun violence all the time, yet it isn’t always reported, therefore, please don’t think Richmond is becoming any safer.
Jake – Are you saying that the RPD is not reporting murders? That would be hard to believe.
Back in 2003-2007 there were 7 killings within 5 blocks of my house (almost 2/year). In the 2 1/2 years since, we’ve had just 1. Last year the body count in the East End was 1/3 of what it was in 2004. The East End went well over 100 days and close to 6 months without a killing from the end of 2009 into 2010 (the best in at least a decade and probably much much longer). Right now Richmond as a city is at the longest stretch without a killing in at least 30 years! Yes there is violence, but you *can’t* say that it isn’t safer.
This is fantastic news!!
Can anybody shed some light on why the City has experienced a decrease in homicides since the 1990s? I have a few ideas…
I’ve heard a few things credited – Project Exile, sector-based policing, better community involvement, and a national trend towards a decrease in violence.
John,
I think Jake was actually referring to gun violence, stabbings, etc. Not just murders. From his perspective he sees alot more than may actually have been reported to the police.
His first two sentences cast doubt on the veracity of the homicide numbers, that’s what I’m responding to.
For “reported”, I assumed that he was referring to the media, not the police. If someone shows up shot or stabbed at the hospital, the police are automatically brought in. If you’re interested in seeing what “isn’t always reported”, the RPD puts out a daily report in Noteworthy Incidents that includes a number of non-fatal stabbings/shootings that don’t get a mention on tv, the newspaper, or even here (though I do get it on the CHPN twitter).
John, just because people don’t die from a shooting doesn’t mean it’s any safer. Spend a day in the ER at MCV and then you tell me honestly how you feel. Right now we have a shot gun victim, female, who’s looks like she’s going to make it. We had another one who was shot mulitiple times earlier in the week, yet the bullets missed every vital organ and the “victim” lives. Sorry John, I see it all, but most of what I see doesn’t get reported.
Jake, you have a tough job, and you see the results of a lot of violence; thank you for what you do. I think if I spent my days in the ER of a Richmond hospital, especially MCV, I’d probably doubt the safety of Richmond’s streets too. It would be interesting to find out what percentage of shooting and stabbing victims wind up at MCV.
I rented a house in Union Hill in 1997, and moved back in 2004 when my husband and I bought our house here. Based on my brief time here in 1997, I really, really had reservations about moving back. My housemates and I lived across the street from a very active crack house, we saw people dealing guns and drugs from the trunk of a car parked in front of our house, and we heard close gunfire (usually in the alley next to our house)every single night.
Yes, there are still guns and drugs in our neighborhood, but not like that anymore. It certainly feels safer than it did 13 years ago.
I get that, but in lieu of hard numbers, I’m looking at the homicide rate as a proxy for the amount of general violence in the city. My assumption is that the number of fatal shootings as a percentage of over-all shootings is a somewhat stable percentage – that less homicides indicate that less people are, in fact, getting shot. I can’t find any data on the number of gun shot victims in Richmond by year which to use for comparison.
To look at this a little bit, I just pulled the assault numbers for the past 5 years (going back to 2004 as the murder count was close to 100 that year). Surprising to me, the relation between the number of homicides and the number of assaults doesn’t show as much of a relation as I would’ve expected. 2005 and 2007 are a clear example of this. The increasing ratio number shows a yearly count of assaults that is falling much more slowly than the number of homicides.
*through June 30
I’m not sure how to really parse this. The category of assault is fairly broad, perhaps there is a specific category or type of assault should be be pulled out for comparison. Sadly, many of the assault incidents appear to be domestic; conversely, the murders that are not happening in Richmond seem to be the street violence killings.
We’re getting beyond what I know & I’ll leave it at this:
Way less people are being killed in Richmond than ever before. This is good.
Jake,
Physicians are required by law to report shootings and stabbings to police, so I very much doubt there are any going unreported.
Released by the RPD today:
Dan-I was referring to the media. Catch a clue!
John–At the risk of putting more work on your shoulders, would be interesting to see if the ratio of aggravated assaults (which the RPD set aside as a notable category) to homicides shows any more stability than your previous assault:homicide ratio did.
It would be interesting, and I think more informative. Unfortunately the RPD’s online system doesn’t break out Aggravated Assaults from Assaults and I don’t have the desire to dig for it. If anyone else wants to follow up, I’d be more than glad to publish the results 🙂
The Hill is safer, but still not safe enough. Shockoe Bottom has not been the same since the murders. I see way less people out there now.
I think local crime UNDER reporting is a valid concern:
http://www.oregonhill.net/2010/06/20/laurel-street-stabbing-this-past-friday-night/
I don’t know about that: your link is to a report about a stabbing in Oregon Hill, which seems to disprove your point about things not being reported. It was reported locally, almost immediately, and then followed up by official information the next day and then a few days later. It looks like these types of incidents may be getting more coverage than ever before.
Yes, not all of the non-fatal incidents make the big media. This was surprising to me at initially, that someone being shot or stabbed wouldn’t be newsworthy. I don’t think that it is under-reporting, per se, so much as just limited media and a sort of geographic bias. The same stabbing in Oregon Hill or shooting up by Fairfield that doesn’t make the news would be played differently were it to go down in Carytown.
This is where the community blogs (and the police department) make a difference in getting information out to areas. Oregon Hill reported a story of direct concern to that neighborhood and the RPD gave supporting details. It worked, it was reported.
In being a regional paper, the T-D would have to post incident reports from Caroline to Dinwiddie and that would take up a chunk of the paper and a lot of resources. They *could* just do Richmond but that would just perpetuate the stereotype of not being able to get 10 feet into the city without being robbed and shot.
Not to say they’re less important but, as a reader, I wouldn’t care if a woman stabbed another if they were acquainted. (I’m making assumptions on the Oregon Hill incident for an example.) Along with being notified when someone is killed in the city period, I’d like to know when something happens at random (which does tend to be released quickly) or is unusual.
Additionally, just because stabbing/gunshot/&c. victims are at MCV doesn’t mean the incident happened in Richmond. It means the wounds were severe enough for a locality to send them to a larger hospital. If they die at MCV from their wounds or if they go home, it’s an incident in their locality and RPD couldn’t care less about it.
An article in today’s Richmond Times-Dispatch reports event lower numbers for 2008 and 2009 than I was given (36 and 41):
Going with the lower number of 32 homicides in 2008, there were 3 months that year with no homicides: May, August, and December. There were incidents those months, but either the charges were withdrawn when declared to be self-defense, or the charge was listed as involuntary manslaughter.
The revision gives us this: going back to at least 1980, Richmond has only had six months without any homicides. Each of these quiet months has come in the last 3 years, and 2 of them have come in 2010.
The longest period with no homicides runs from Thursday, July 24, 2008, to Friday, September 26, 2008 – a span of 64 days. At the end of 2008 going into 2009, the run of 56 spanning November 9, 2008, to January 4, 2009, is the 2nd longest period. As of July 10, 2010, Richmond has gone 48 days without a homicide – the 3rd longest period since at least 1980.
I’ve got updated data going back to 1934. Turns out that you have to go back to 1951-1961 to find years with per capita numbers as low as 2008 (which is still better than most years from the 1930s and 1940s, interestingly).
Here are the source population and homicide numbers for Richmond 1934-2010. (PDF)
Why did the population spike in 1970?
That and the spike in 1942 are from annexation of county land/population.
Back when the RTD did that report on murders in Richmond, I found a website that reported murders for Richmond and 7 surrounding counties. I can’t locate it now, but murders in Richmond exceeded all the surrounding counties combined. I’m thinking assaults and other crimes are much higher here also.
This is a great report, truly, but the reputation Richmond has as being a dangerous place is not undeserved. Unquestionably things have improved, but murders in Shockoe Bottom, shootings and stabbings in the projects and the recent line of fire killing on Belvidere only comfirm in many people’s minds (mine included, that Richmond is not a safe (enough) place to visit or live, especially at night. Why do I still live here? Habit, I think.
I post hard data showing that RIchmond is safer than any time in the past 60 years and your response it’s not a safe enough place to live or visit? More facts: through the first six months of 2010, RVA had only 19 of the 51 killings in the area (and it’s 25 of 57 as of today). It really is different here than it used to be.
My question to Jake is how long have you worked at MCV?? Just because you see people coming in with gunshot/stab wounds doesn’t mean it isn’t less than it has been in the past. What is the basis of YOUR comparison?? Were you working there at the height of the RVA violence? Is that your point of reference??
John is right. Richmond is a safe place to live…with a very few neighborhoods that are not safe. Neighborhood policing and the allocation of resources to trouble areas is working. If we could get illegal guns off the streets, the difference would be huge. The sad truth is that if you are middle or upper class, you have almost no chance of being a victim of violent crime. If you are poor, young, male, involved in drugs or frequent certain clubs, the risks are much greater.
john unfortunately you seem to be running into the “who are you gonna believe me or your lying eyes syndrome”. dont let it get you down. wrapping yourself in a blanket of ignorance is the only way to keep stupid thoughts warm.good work and thanks nfor digging so hard. if anybody else has conflicting data lets see it and YOUR bonafides. hey it might be a good time to develop some new habits.