
RECENT COMMENTS
Eric S. Huffstutler on What is up with the Church Hill Post Office?
Eric S. Huffstutler on What is up with the Church Hill Post Office?
Yvette Cannon on What is up with the Church Hill Post Office?
crd on Power Outage on the Hill

Neighborhoods crime map 2013
01/09/2014 12:26 PM by John M
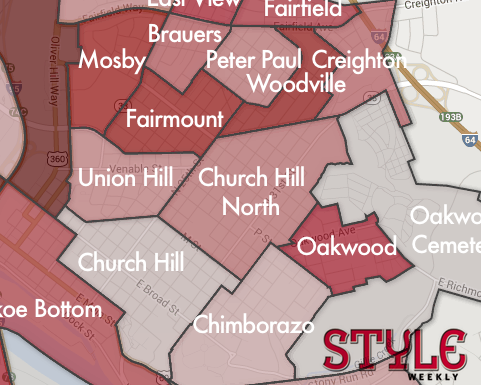
Ned Oliver at Style Weekly has posted a neat mapping of the city’s neighborhood crime rates last year.
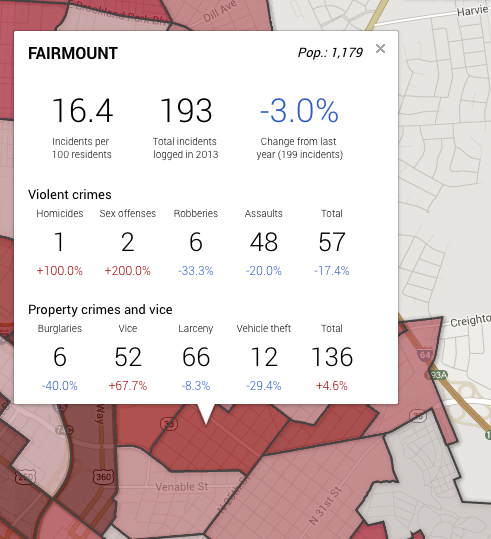
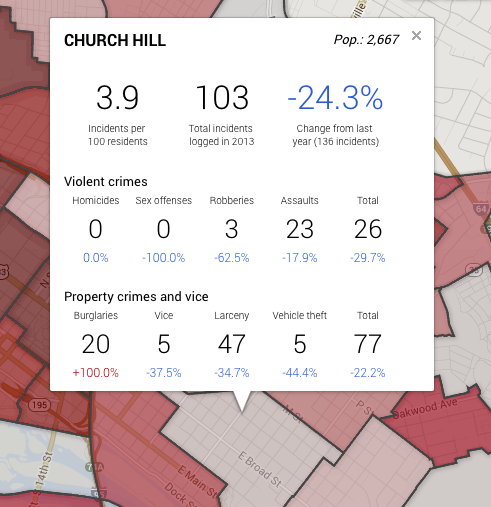
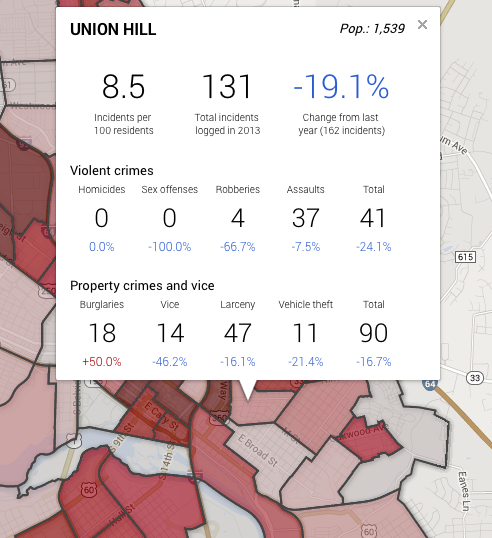
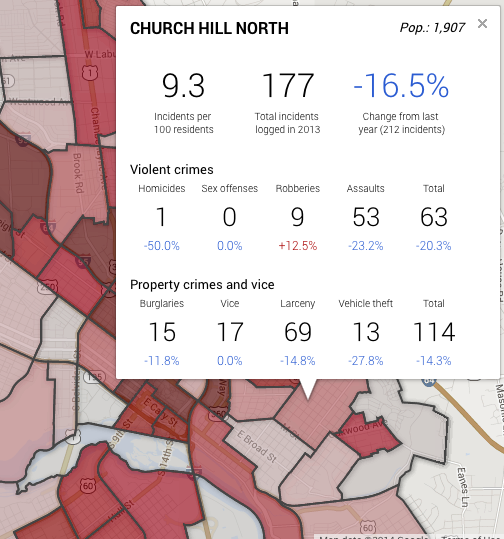
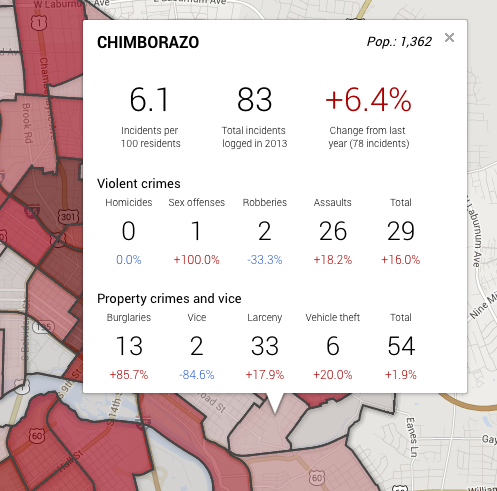
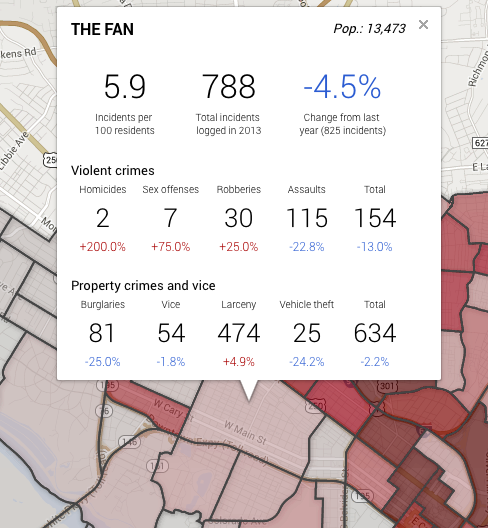
Click on a neighborhood to see the number of incidents per 100 residents, change in number incidents from 2012, and a breakdown as to what types of incidents are happening.
Of note is the amazing drop in incidents in Church Hill (-24.3%), as well as declines in Church Hill North, Union Hill, Mosby, Peter Paul, Fairfield, East View, Creighton, and Fairmount. At 3.9 incidents per 100 residents, Church Hill compares very well to The Fan (5.9), Windsor Farms (3.8), Carillon (5.2), Museum District (3.2), and Bellevue (4.6).
Interesting. If its all correct, I gotta give RPD 1st precinct some props. Thanks guys.
And thank Jesus I don’t live in Fairmount. Holy crap.
Right up there with the mean streets of Windsor Farms eh? Props are in order for Lt. Dan and his crew!
So the “Church Hill” neighborhood has fewer crime incidents per 100 residents than the Fan? Did I just read that correctly? If so, is this the first time that has occurred? If so, truly a pivotal moment. Can’t wait to send to all my Fan friends.
For many years Church Hill has been far below the number of crime incidents than the Fan. But yes, when compared to population, this year, Church Hill also has a lesser percentage of crime. If you go to the RPD website, the sheer # of crimes occurring in the Fan is staggering. Church Hill has not seen #’s like those in years. It’s also amazing to me how under-reported by the media the crime is in the Fan. But, just let some much as a shed be broken into in Church Hill, it’s immediately a top news story across the city. * I think* this website is partially responsible for that. Sorry John…you do such a great job that many reporters throughout the city use this website to get their stories. (:-) you’re damned if you do…) On the counter, this site also does much d dis spell and change so many negative perceptions of the Hill.
Is any media source picking these stats up and broadcasting them across the city? I doubt it.
@laura 🙂
congratulations, Lt. Dan and all 1st. RPD. Your daily presence, out and about has meant all the difference in CH. Thank you for above and beyond and the bike patrols,
@5 – exactly, where are all those reporters asking if they could talk to someone on this story? This is a really important story to tell and they should put this on the nightly news!!!
When you compare this map to a few others it tells a different story.
First, compare the relevant precinct map, http://www.richmondgov.com/police/Precinct1Sector111.aspx . If you add up crime and population you,ll find a rate of 7.0 per 100 people (891/12583) is the actual measure of performance.
Now, compare median income, http://www.city-data.com/nbmaps/neigh-Richmond-Virginia.html and you’ll see that the neighborhood has dramatically higher income than its surroundings and most of the city.
While it is no small feat to have a low crime rate in a roughly 6×10 block area of any major city, the rate doubles or more in almost every direction. Thematic maps that use cloropleth instead of point data do not accurately show concentrations. There are some serious issues socioeconomic issues in this data that should out shadow any geopolitical bragging rights.
Chris…how long is your historical memory of Church Hill?